Project Examples
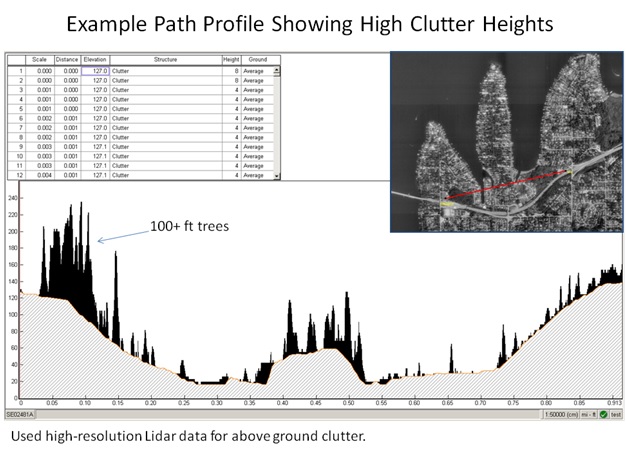
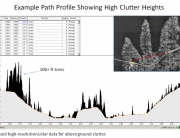
Terrain and Clutter Path Profiles
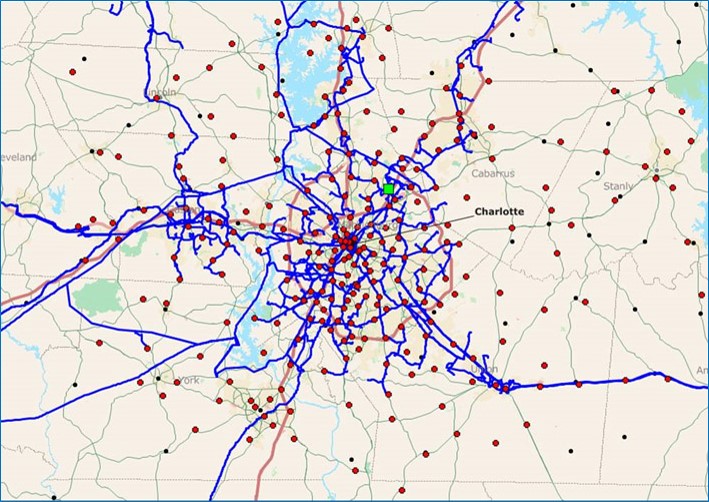
GIS, Point-to-Point Links
In this example, we used 1/3 second terrain elevation data with high-resolution LIDAR clutter data.
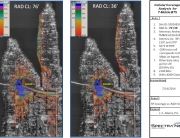
Outdoor Coverage Using LIDAR Clutter
GIS, Outdoor RF Coverage
Cellular coverage for 2100 MHz 3-sector LTE BTS using 1/3 second elevation and high-resolution LIDAR clutter.
Spokane 700 MHz LTE RF Coverage
GIS, Outdoor RF Coverage
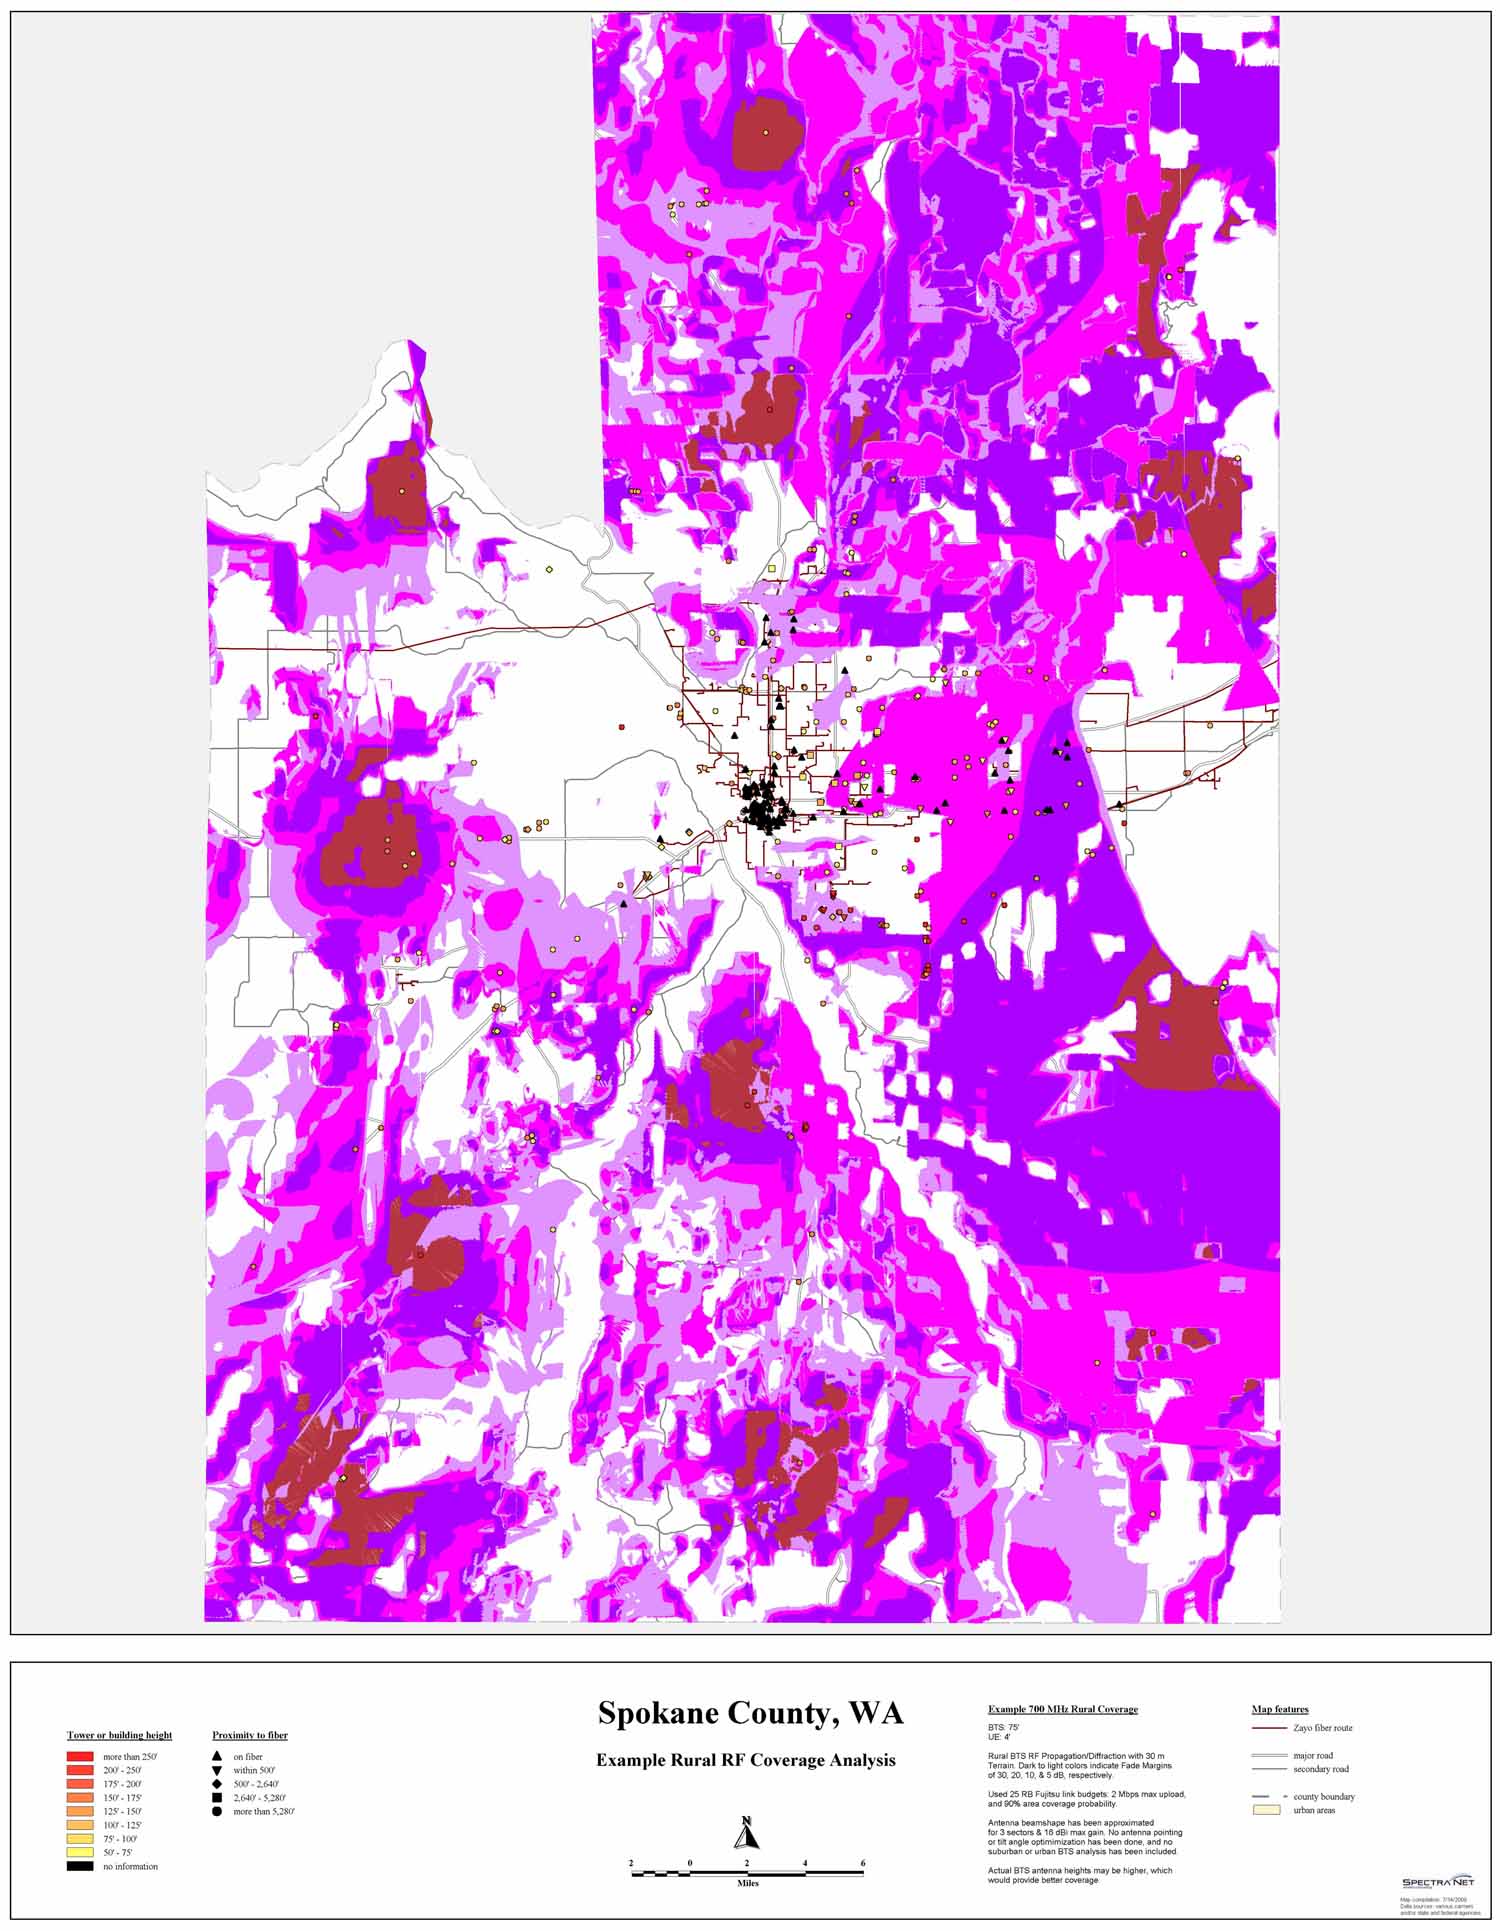
RF Coverage for 700 MHz LTE for multiple cell sites in Spokane County.
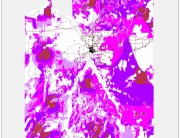
Spokane 700 MHz LTE RF Coverage
GIS, Outdoor RF Coverage
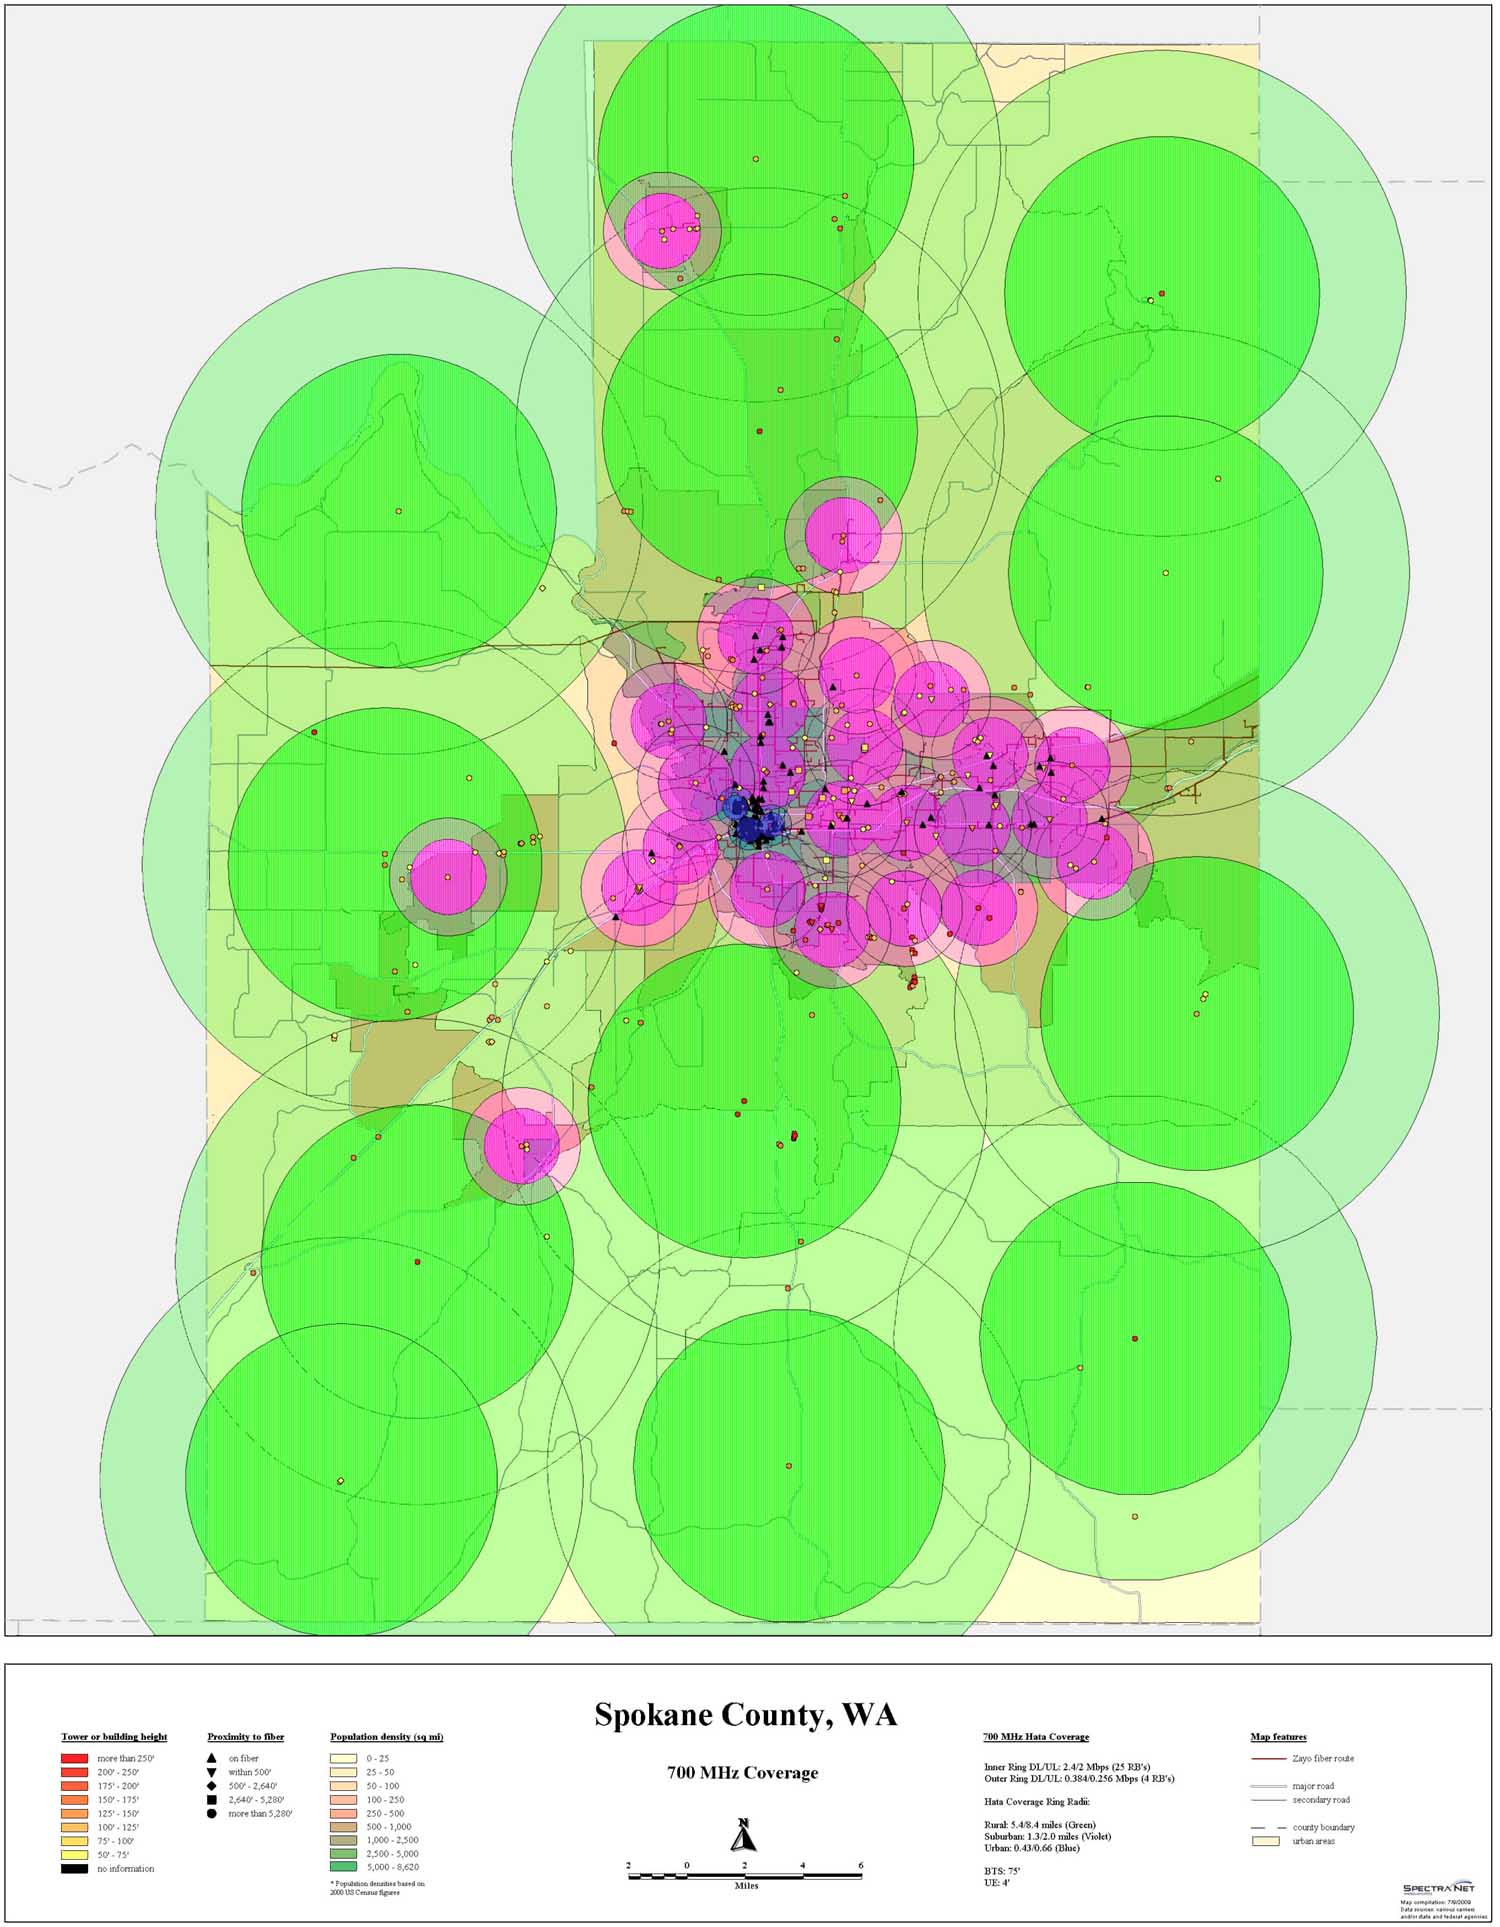
RF coverage calculation using Hata model for urban, suburban, and rural areas in Spokane County.
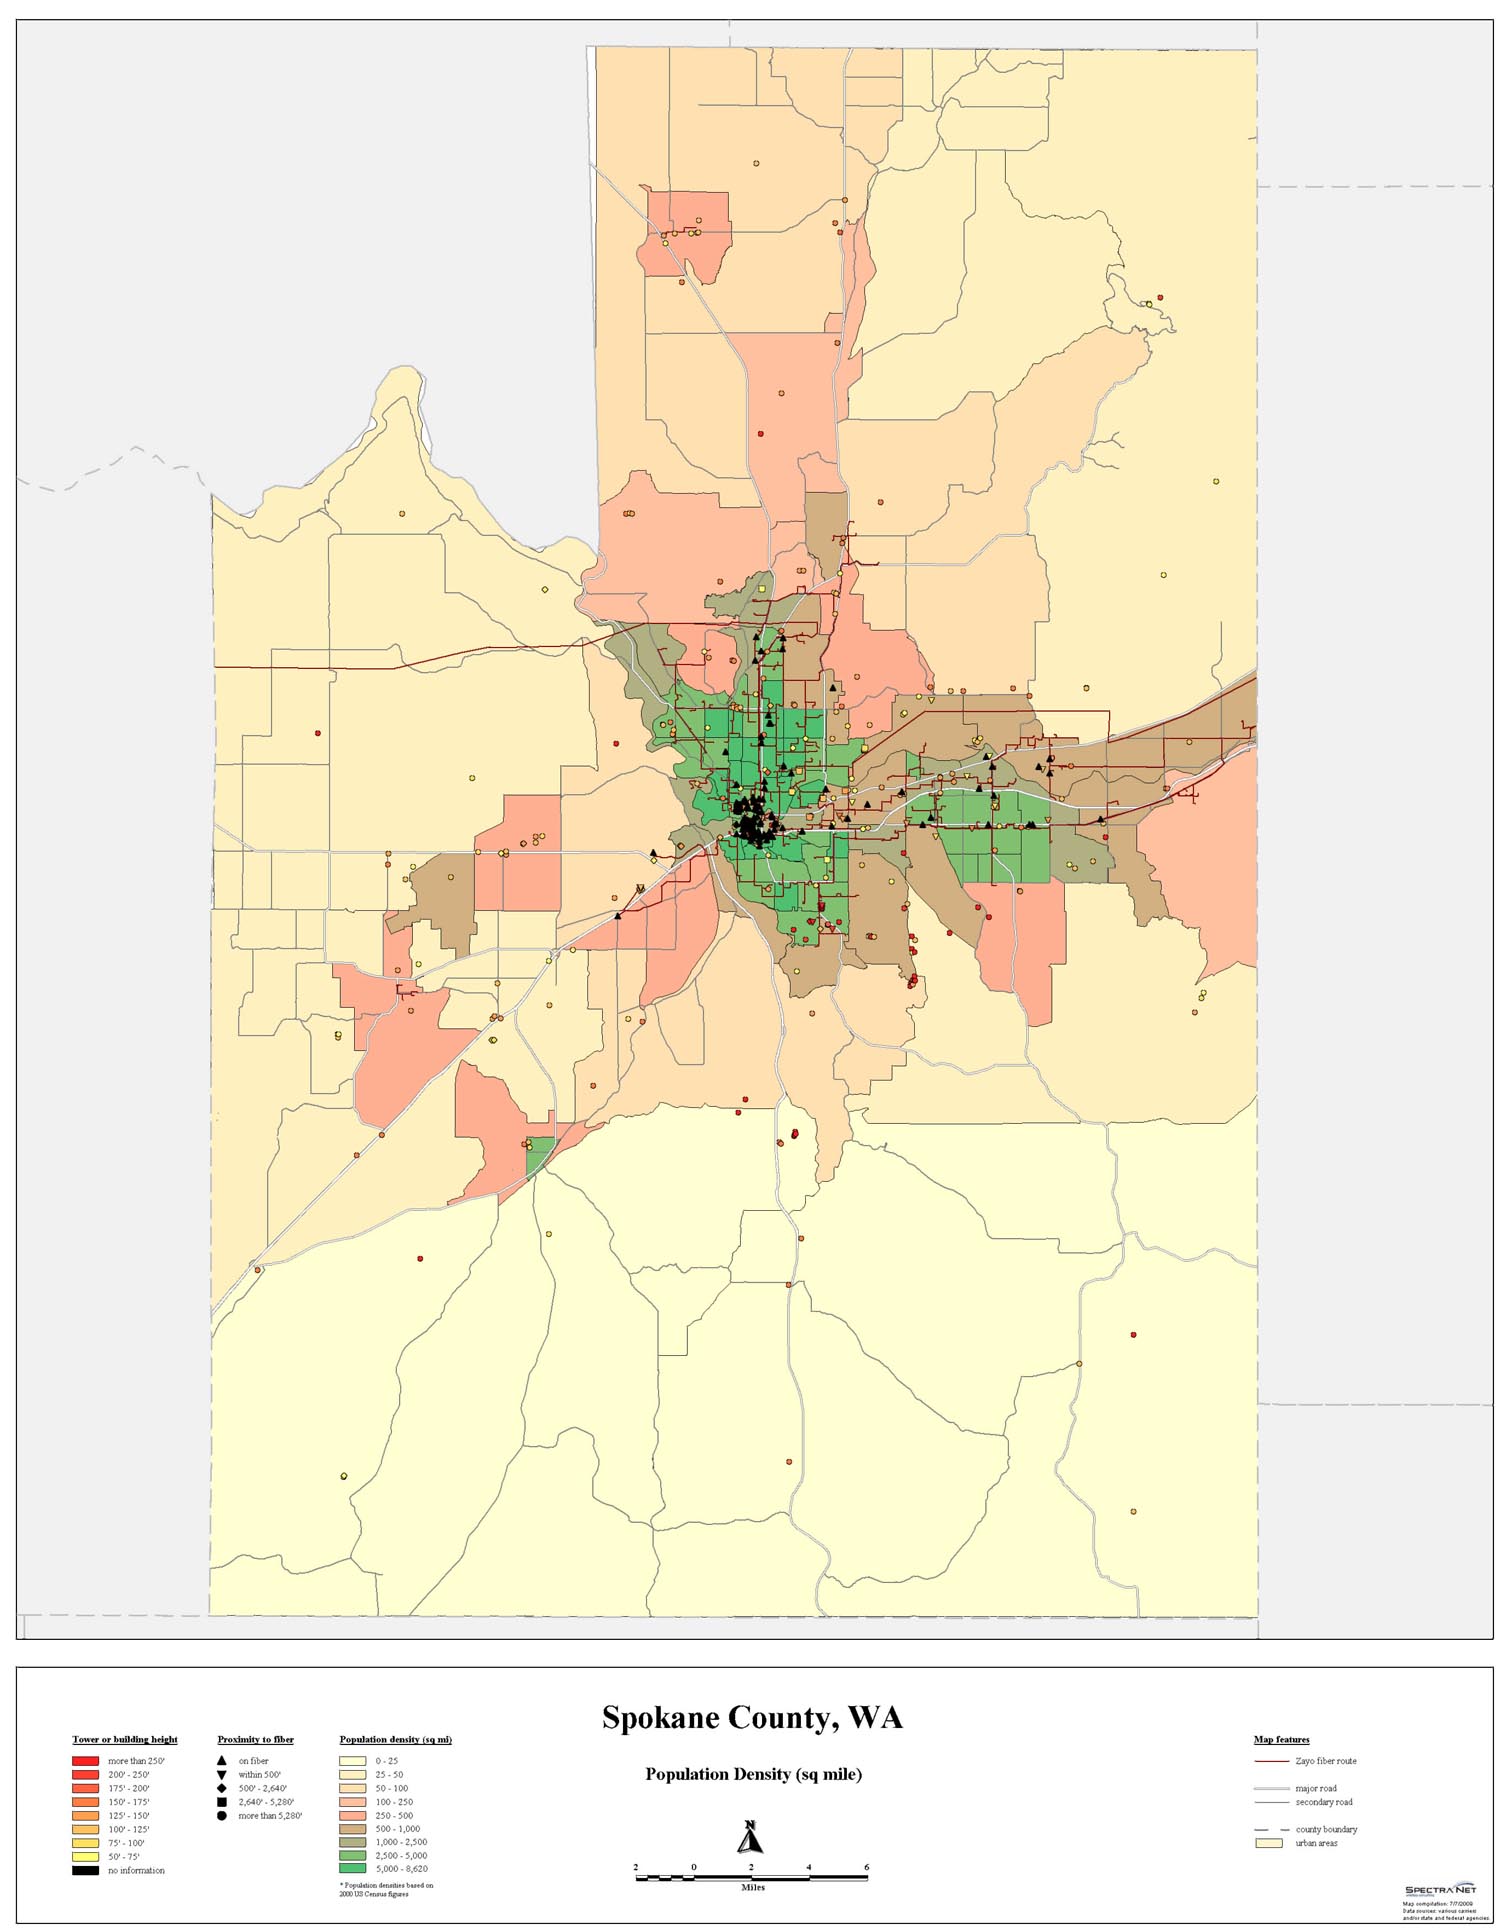
Spokane County Population Density Map
GIS
Population density map showing available fiber and towers (with heights), and distance from fiber connection points. Population density maps can be useful when trying to estimate cellular loading. For example, there are rules of thumb for the percentage of a population that has an active wireless connection as a function of time of day, so along with information like typical data-rate usage statistics and percentage of a market serviced by a particular carrier, we can estimate the number of base stations needed in a given region.
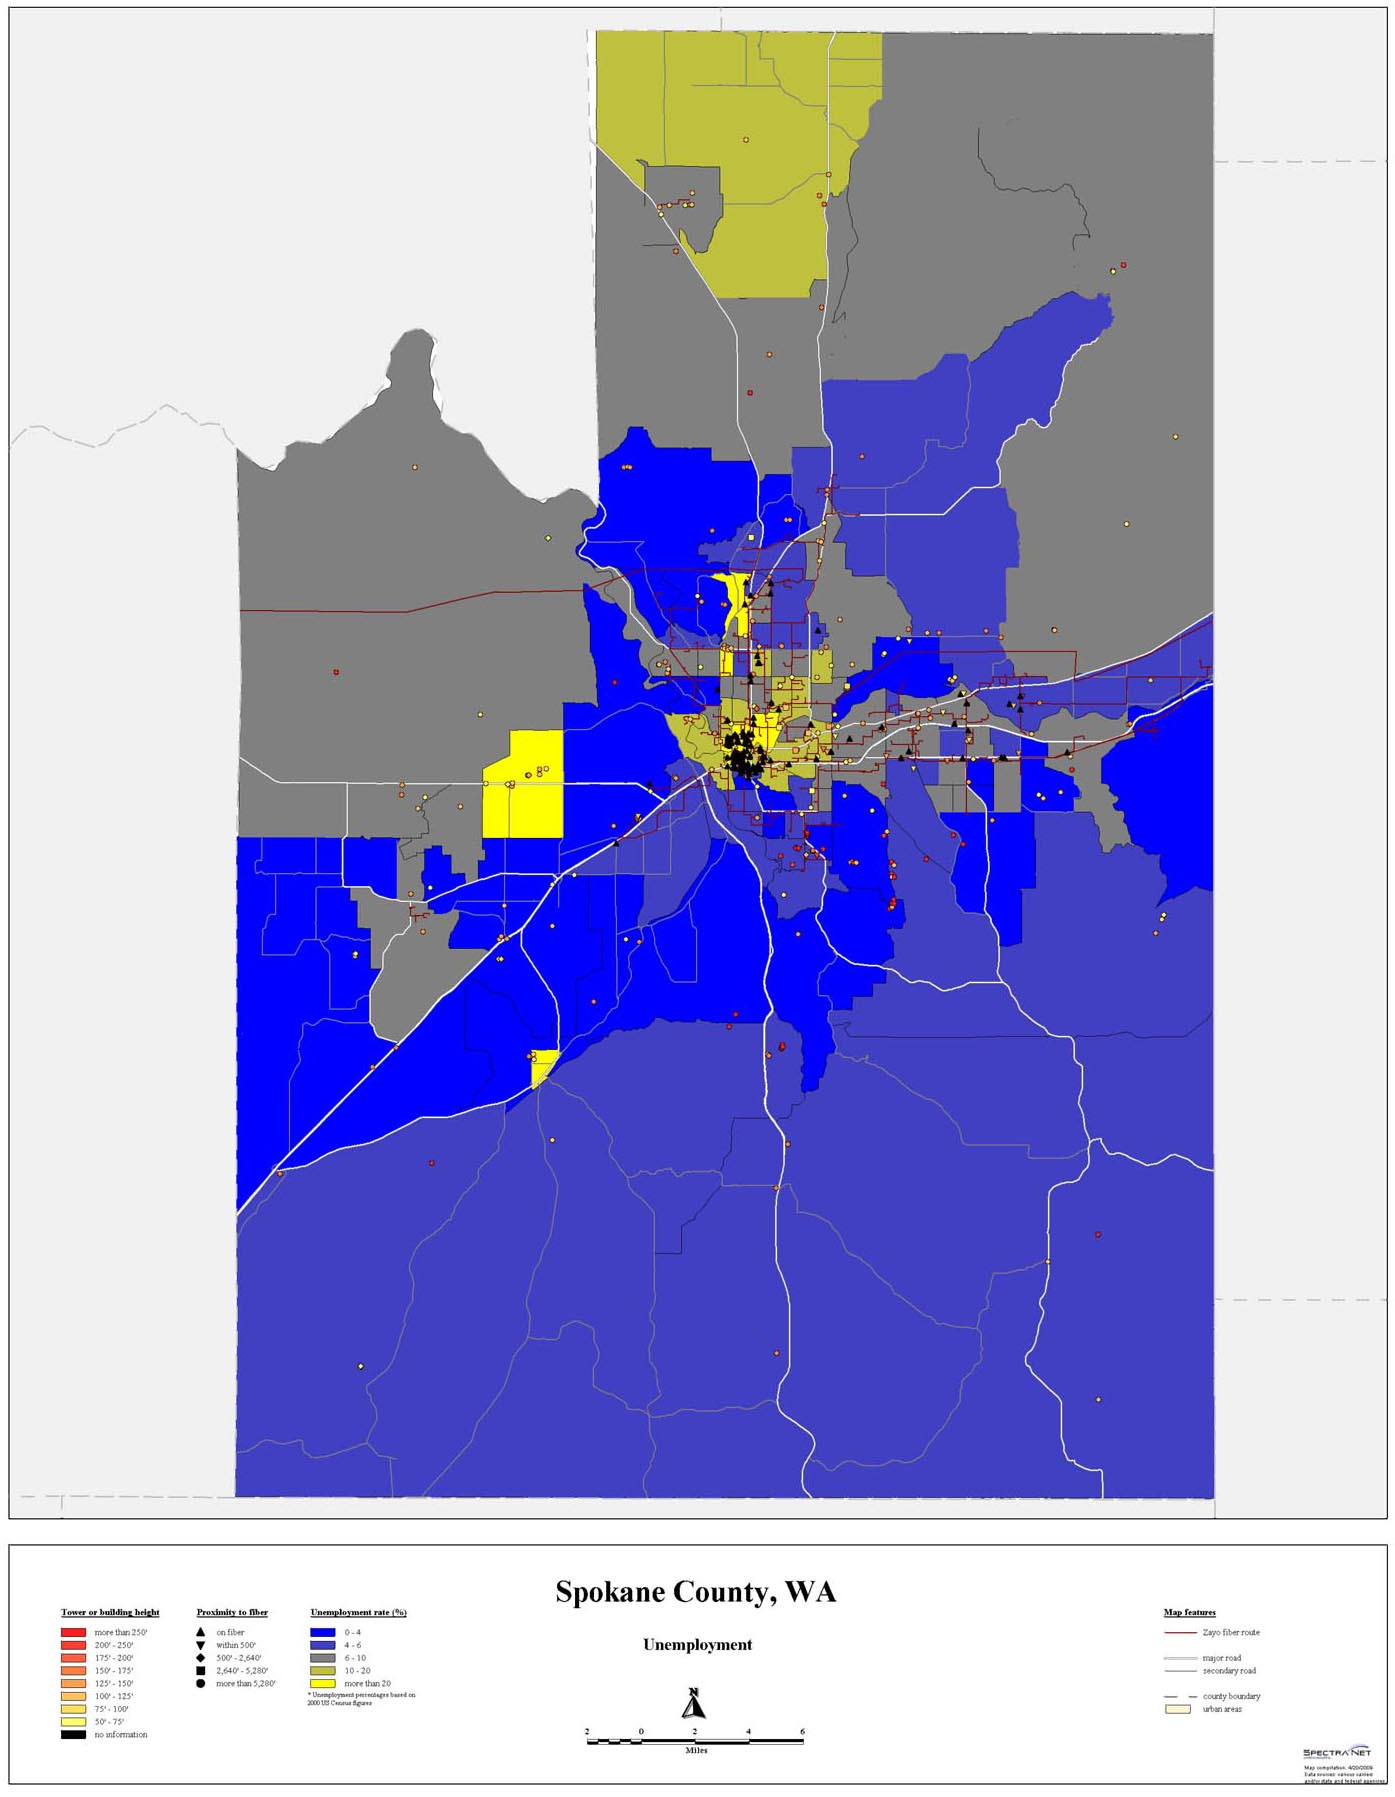
Spokane County Employment Map
GIS
Employment map showing available fiber and towers (with heights), and distance from fiber connection points.
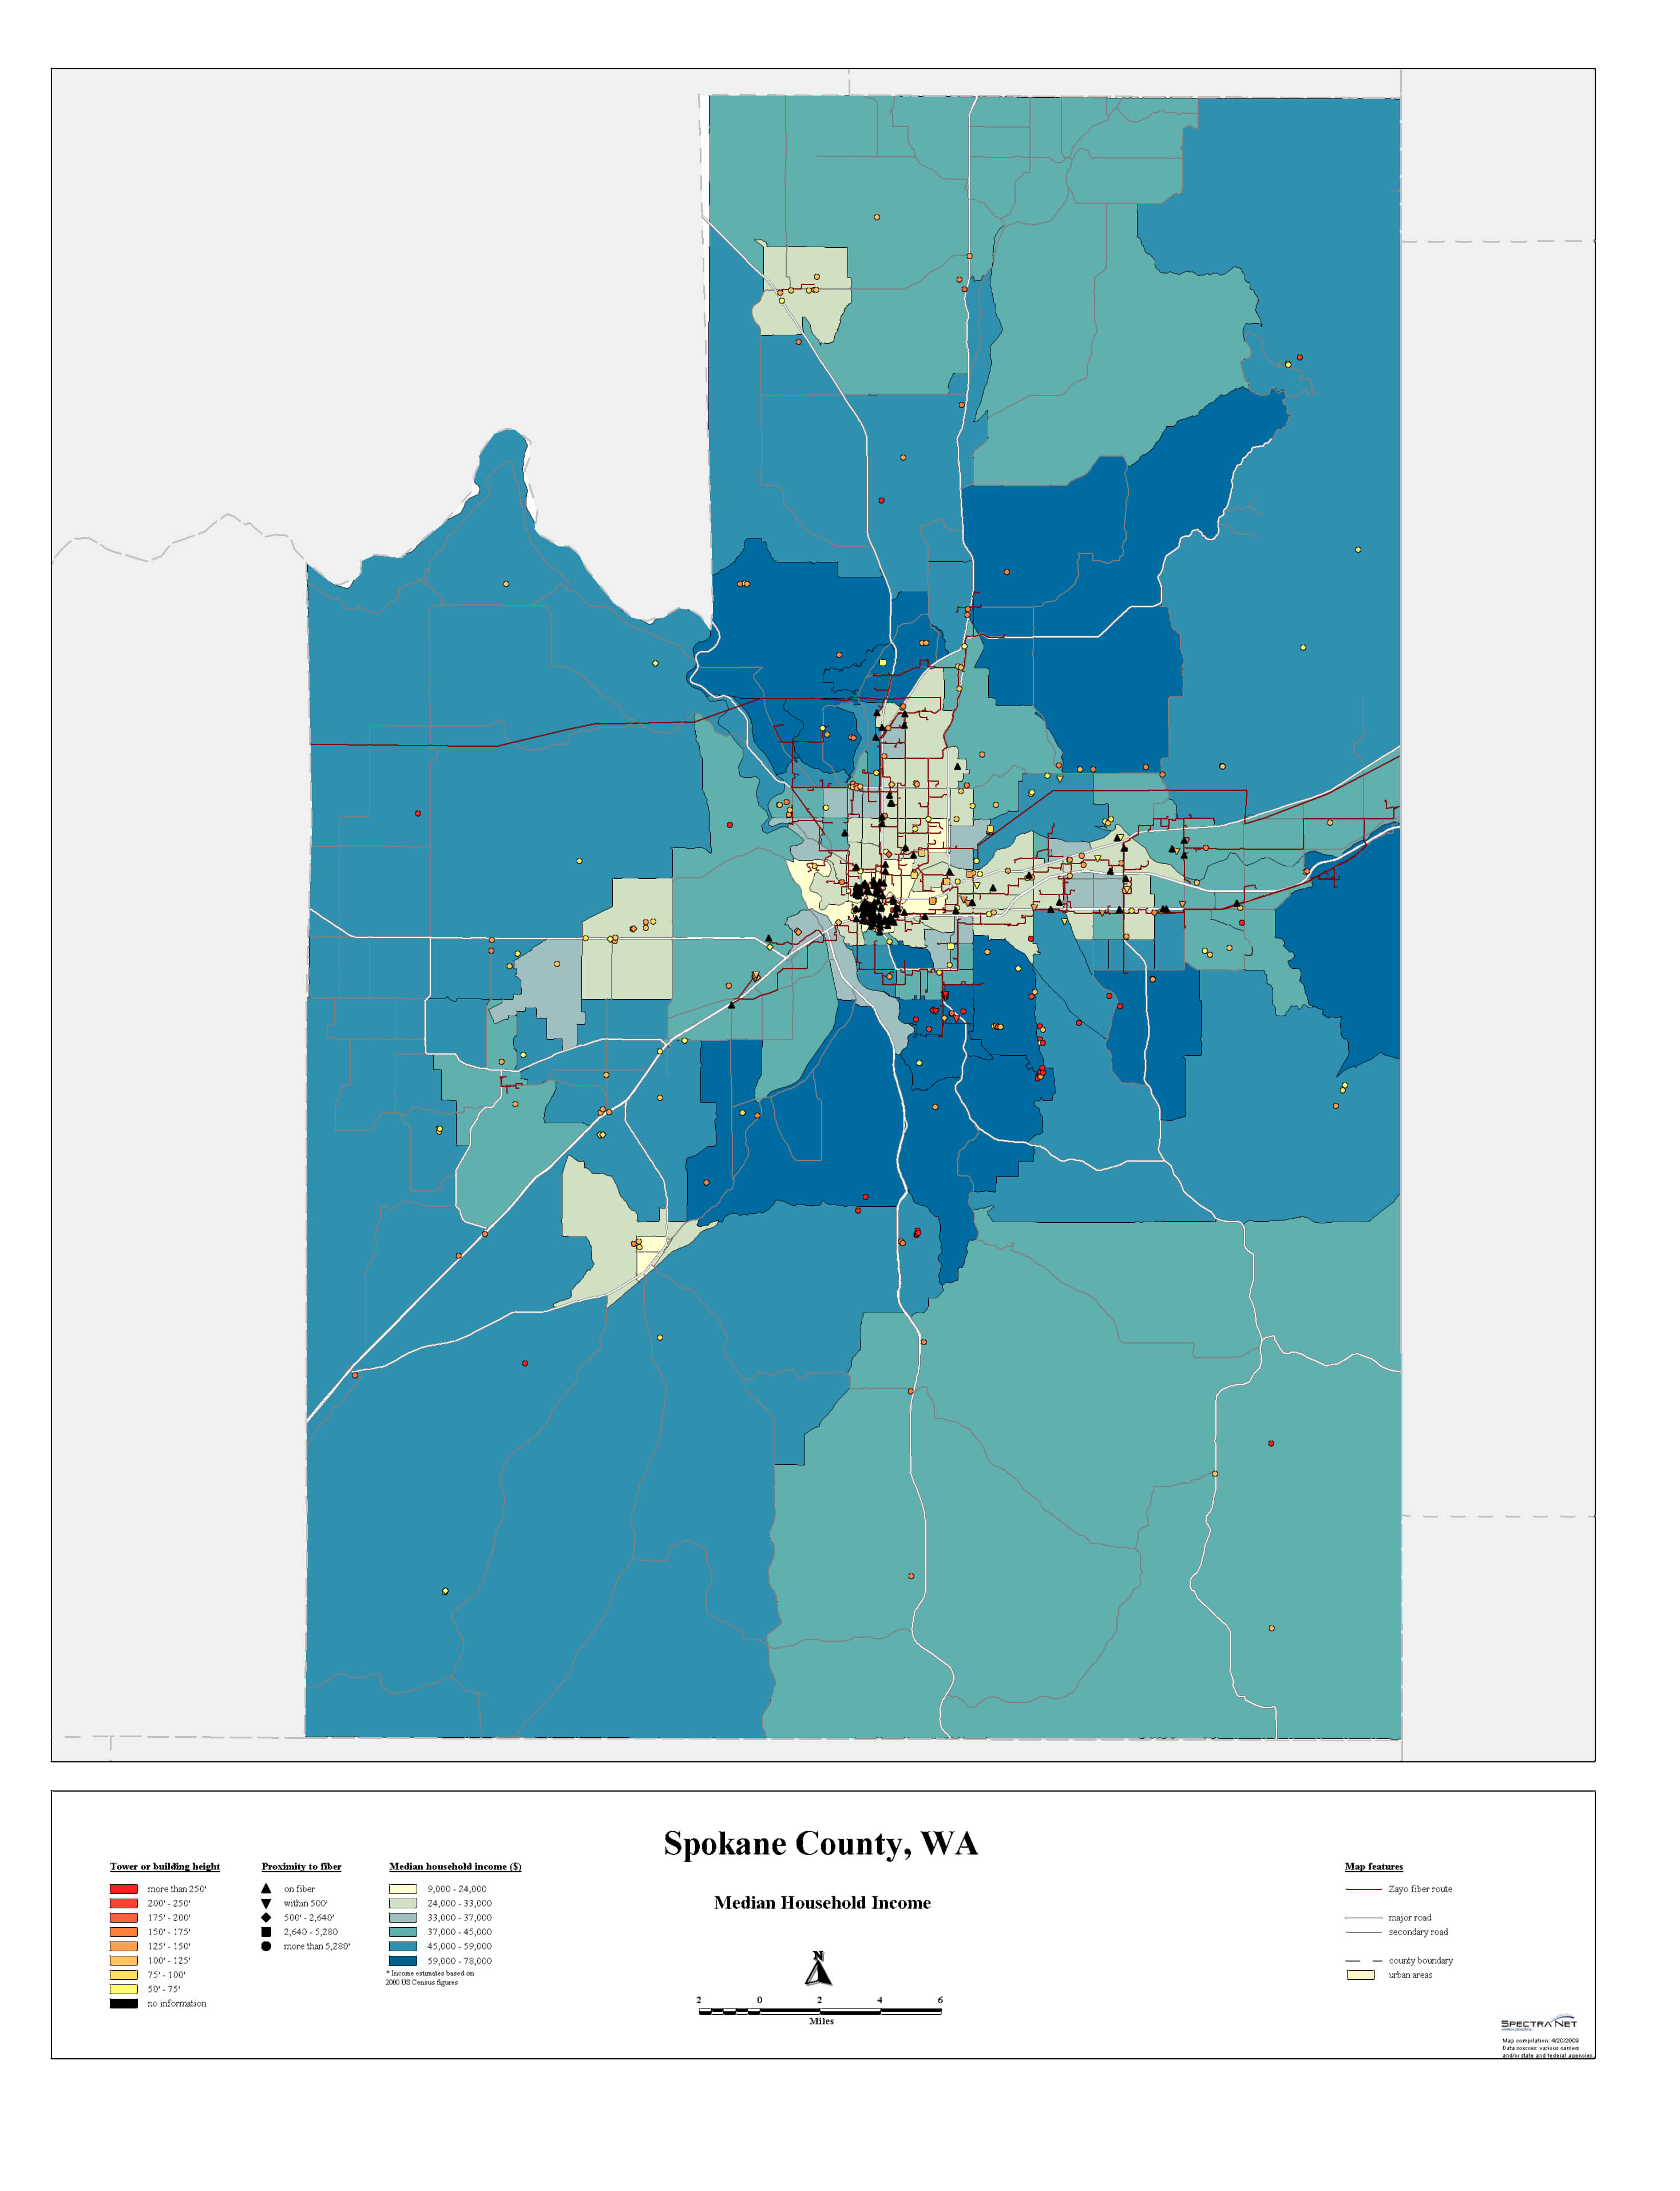
Spokane County Income Map
GIS
Income map showing available fiber and towers (with heights), and distance from fiber connection points.
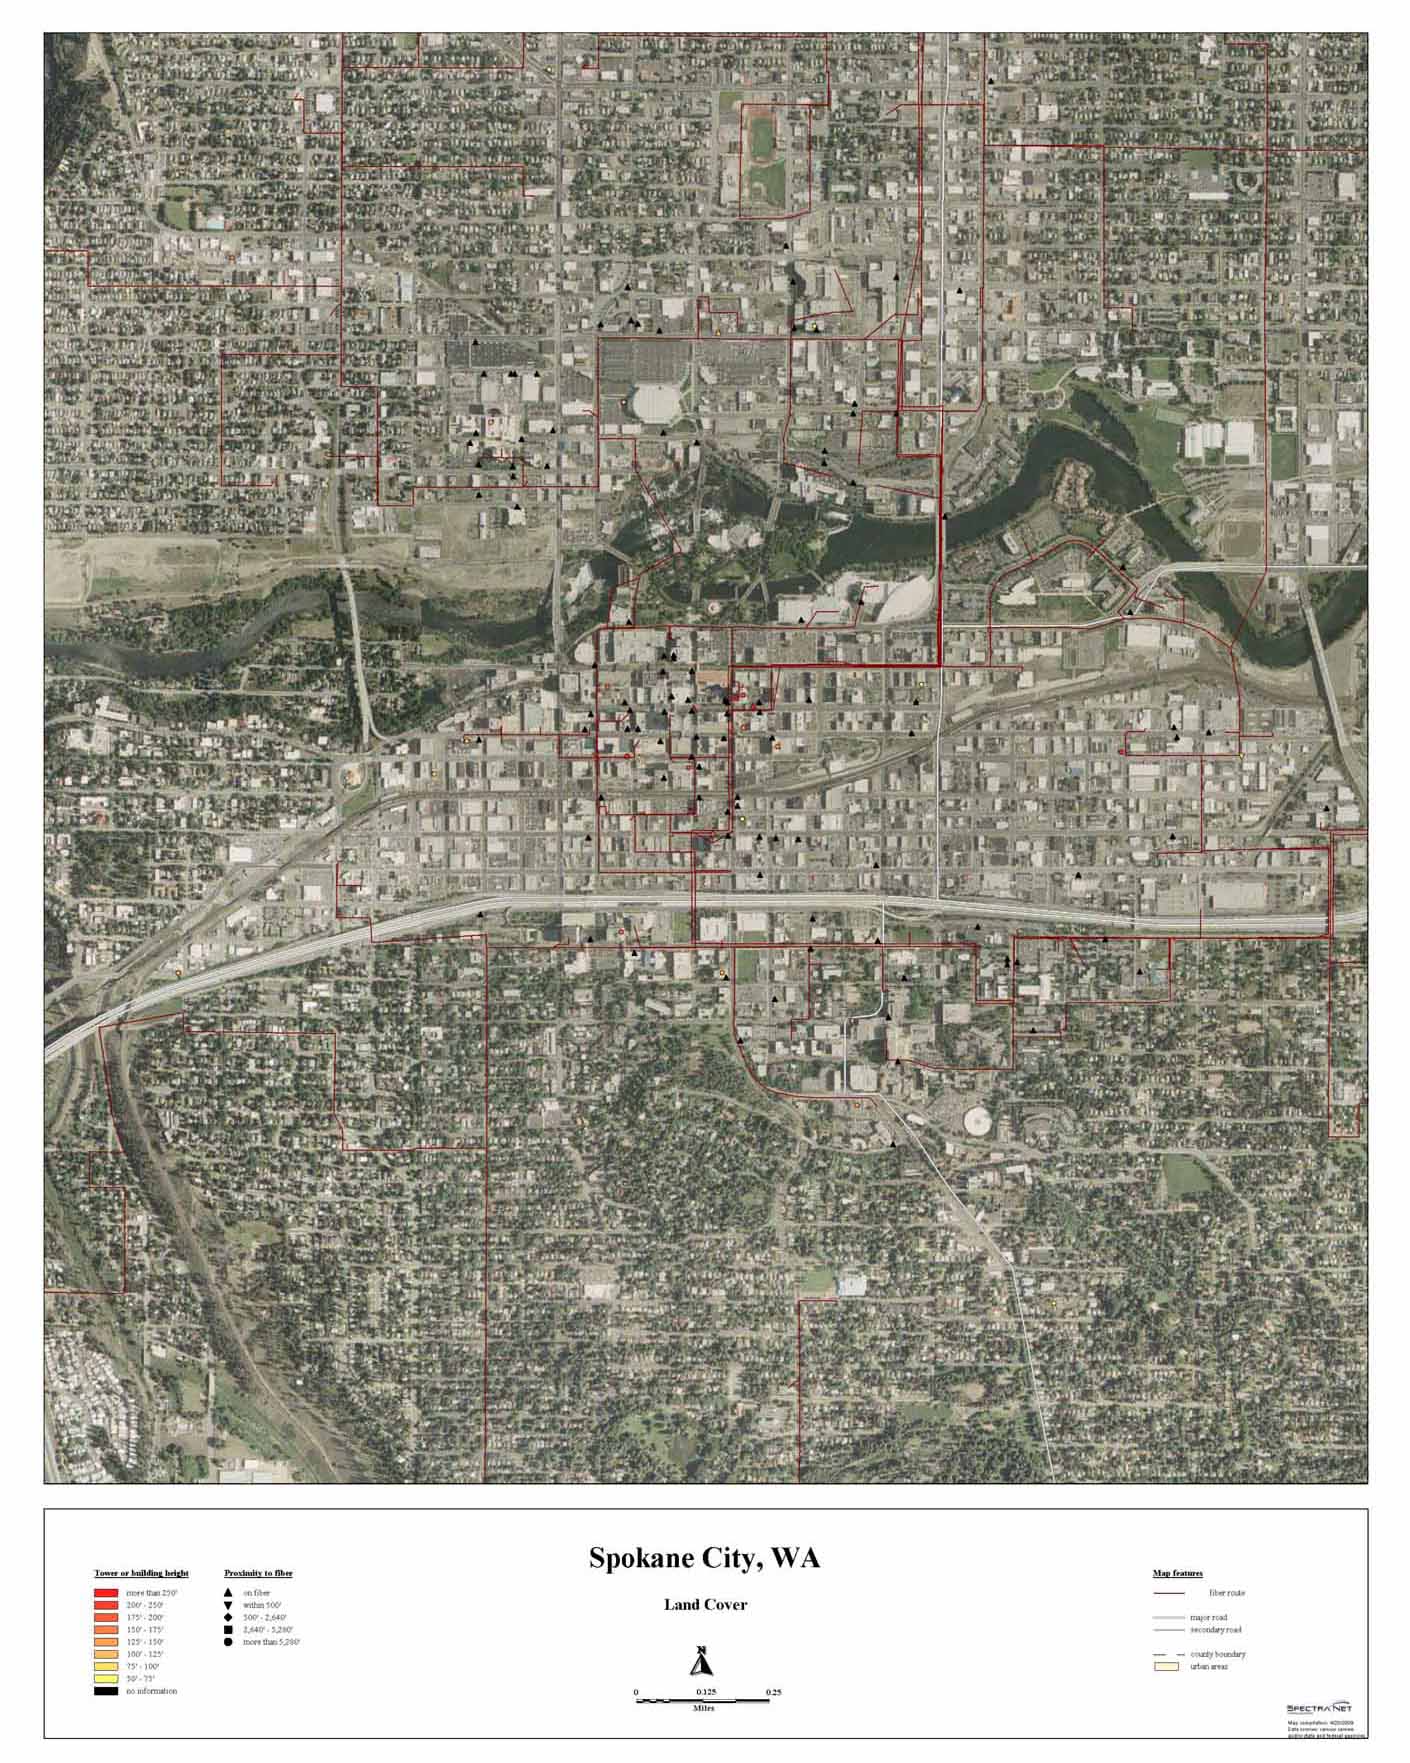
Spokane Aerial Map
GIS
Aerial map showing available fiber and towers (with heights), and distance from fiber connection points.

